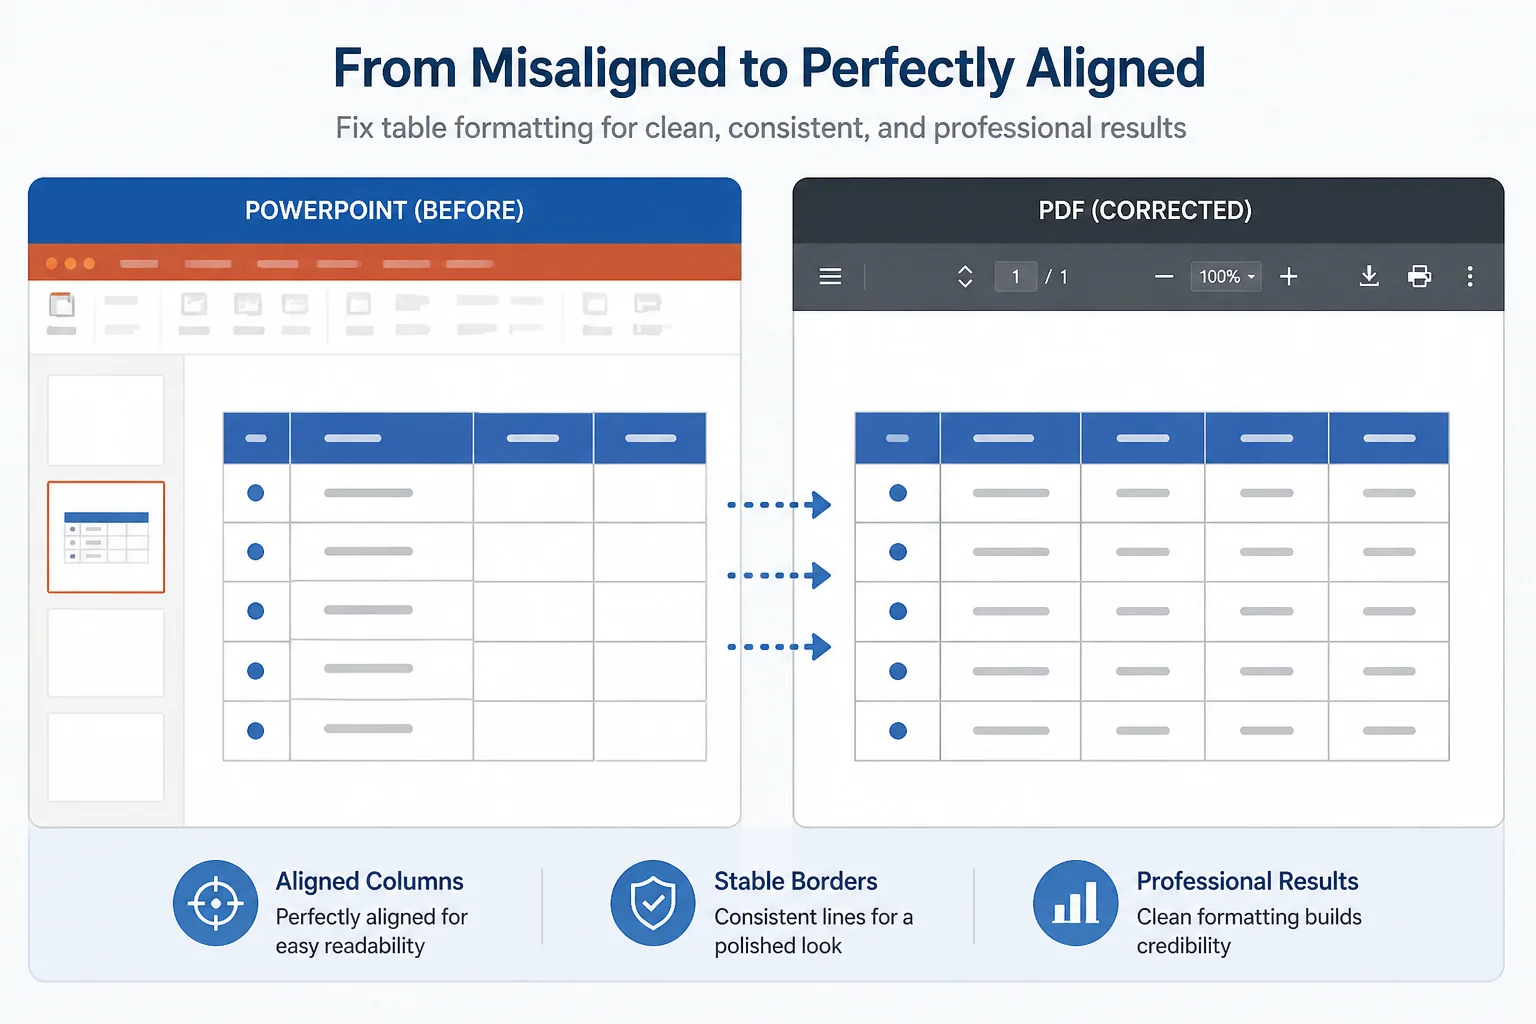
When PowerPoint tables shift in a PDF, the problem is usually caused by a difference between how the presentation is displayed and how the PDF converter calculates text, spacing, and page geometry. Columns may move, rows may become taller, text may wrap differently, or borders may no longer line up.
The most reliable fix is to stabilize the table in PowerPoint before conversion: use a common font, set explicit row and column sizes, remove unnecessary spacing, check the slide dimensions, and inspect the exported PDF at normal zoom. If the table still changes, simplify complex formatting or try a different conversion method.
Why PowerPoint tables shift after PDF conversion

A PowerPoint file is an editable layout. A PDF is a fixed-layout document created by an export or conversion engine. During that process, the software must turn editable text boxes, table cells, fonts, and slide measurements into precisely positioned PDF objects.
Small differences can produce visible changes. Common causes include:
- Missing or substituted fonts: A replacement font may be wider or narrower, causing text to wrap and changing the apparent height of a row.
- Automatic sizing: PowerPoint may fit text or adjust a cell while the PDF converter uses a different calculation.
- Inconsistent column widths: Manually dragged boundaries can leave columns slightly different from one another.
- Paragraph spacing: Extra space before or after text can push content down inside a cell.
- Slide size differences: A presentation designed for one aspect ratio may be exported with different page proportions or scaling.
- Complex table styling: Transparency, gradients, unusual borders, grouped objects, and overlapping shapes can be interpreted differently.
- Conversion-engine differences: PowerPoint’s own PDF export and third-party converters may not render every object identically.
First, identify what changed in the PDF
Before editing the original presentation, compare the PowerPoint slide and the PDF carefully. Open both at approximately the same zoom and look for the specific failure:
- Are the entire table and its borders displaced?
- Did only the text move inside the cells?
- Did one column become wider or narrower?
- Did text wrap onto an additional line?
- Are rows taller, clipped, or overlapping?
- Did the table move because another object changed position?
- Are borders missing, too thick, or slightly misaligned?
This distinction matters. If the table’s outer boundary is correct but the text is wrong, inspect fonts and paragraph settings first. If the whole table is in the wrong place, check slide dimensions, object positioning, and conversion scaling.
Fix fonts and text wrapping first
Font substitution is one of the most common reasons a table changes after export. A font that looks compact in the original presentation may not be available to the conversion process. The substitute can use different character widths, line spacing, or metrics.
- Select the table and replace unusual or decorative fonts with a widely available font.
- Use the same font family consistently throughout the table.
- Check bold and italic variants separately; missing font styles can also trigger substitution.
- Reduce the amount of text in crowded cells where possible.
- Preview every cell that is close to wrapping onto another line.
Do not rely on a line break that appears accidental or automatic. If a cell must break at a specific point, insert a deliberate line break and make sure the row has enough fixed height to contain it. However, avoid forcing breaks everywhere: a manual break can become awkward if you later edit the wording.
Turn off automatic fitting in crowded cells
PowerPoint may shrink text, expand a cell, or adjust text placement to make content fit. These behaviors can produce different results during PDF conversion, especially when a cell is already close to its limits.
For important tables, use a predictable layout:
- Set a readable font size instead of allowing text to shrink indefinitely.
- Use explicit row heights when every row must align visually.
- Set column widths deliberately rather than relying on automatic distribution.
- Increase cell margins slightly if text is touching a border.
- Remove unnecessary paragraph spacing inside cells.
In PowerPoint, text fitting options are available through the text formatting and shape formatting controls, although the exact labels can vary by version. The goal is to prevent the application from making last-second layout decisions. After changing these settings, inspect the longest cell in each column and export a test PDF.
Set exact row heights and column widths
A table can look aligned while still containing small, inconsistent measurements. This often happens when boundaries have been adjusted by eye. During conversion, those differences may become more noticeable.
Select the relevant rows or columns and use the table layout controls to enter consistent dimensions. For example, if a report table has four data columns, decide whether those columns should be equal or whether one needs additional width for longer descriptions. Then apply the intended widths explicitly.
Also check the following:
- Distribute columns only when equal widths are actually wanted.
- Distribute rows when the design requires a regular vertical rhythm.
- Confirm that text alignment is consistent across comparable cells.
- Check that a merged header cell spans the intended columns.
- Look for tiny gaps caused by overlapping or nearly touching table objects.
If the table is made from separate text boxes and lines rather than a real PowerPoint table, align and group those objects carefully. A native table is usually easier to stabilize than a collection of independently positioned shapes.
Remove paragraph spacing and unwanted cell margins
Text that appears vertically centered in PowerPoint may move when line spacing or paragraph spacing is interpreted differently. This is particularly noticeable in narrow rows with one or two lines of text.
For each table cell, review:
- Line spacing
- Spacing before and after paragraphs
- Vertical alignment
- Left and right cell margins
- Top and bottom cell margins
Use simple paragraph settings for compact tables. Remove extra space after paragraphs unless it is part of the design. If the table contains multiple paragraphs, check each one rather than assuming the entire table uses the same formatting.
Check the presentation’s slide size and orientation
A table may appear to shift because the PDF page is being scaled, not because the table itself has changed. This can happen when a presentation uses a nonstandard slide size, switches between portrait and landscape, or is converted using a page setting that does not match the original.
Before exporting, open the presentation’s slide size settings and confirm:
- The intended aspect ratio is selected.
- The orientation is correct.
- The table fits within the slide’s safe area.
- No part of the table is positioned beyond the slide edge.
- The PDF conversion method preserves the presentation’s page proportions.
A table placed very close to the edge is more vulnerable to clipping or apparent movement. Leave a modest margin around the table, especially when the PDF will be printed.
Simplify borders, fills, and effects
Table borders can appear shifted even when the cell content is in the correct location. Thin strokes, semi-transparent lines, shadows, and layered shapes may render differently in a PDF.
For a dependable export:
- Use solid borders with consistent line weight.
- Avoid extremely thin rules on tables that must print clearly.
- Remove shadows and glow effects from table cells.
- Use simple solid fills instead of complicated transparency effects.
- Check whether a colored line is actually a separate shape placed over the table.
If a table uses separate rectangles or lines to imitate borders, consider rebuilding it as a native PowerPoint table. This reduces the number of independently positioned objects that the converter must reproduce.
Use a reliable conversion workflow
Exporting directly from PowerPoint often gives the closest match to the original file because the application already understands its own layout model. If PowerPoint is unavailable, a dedicated PPTX-to-PDF converter can be useful, but the result should still be checked visually.
A practical workflow is:
- Save a copy of the original presentation.
- Make the table layout predictable using the steps above.
- Export one or two representative slides first.
- Open the PDF and inspect the most crowded table.
- Check the PDF at 100% zoom and, if relevant, print a test page.
- Only then convert or export the complete presentation.
If you need to convert without having PowerPoint installed, see this guide on converting PowerPoint to PDF without PowerPoint. For a browser-based workflow, you can also review the guide to converting PPTX to PDF online.
What to do when only one table is broken
If most slides export correctly and one table shifts, avoid changing the whole presentation immediately. The problem is probably local to that table.
Try these targeted fixes:
- Copy the table to a new blank slide and test the export.
- Remove and reapply unusual formatting to the affected cells.
- Replace the font in the affected table only.
- Unmerge and re-merge cells if a header is misaligned.
- Rebuild the table on a clean slide if it contains many pasted objects.
- Check for hidden shapes or text boxes overlapping its boundaries.
Copying the cell contents into a newly created table can be faster than repairing a table that has been edited repeatedly or pasted from several applications.
When converting the table to an image makes sense
For a final, non-editable PDF, converting a particularly complex table into a high-quality image can preserve its visual appearance. This can help with charts, heavily styled tables, or layouts containing many layered objects.
There are trade-offs. An image-based table may contain text that is harder to search, copy, or read with assistive technology. It may also become blurry if the image resolution is too low. Use this approach only when visual stability is more important than editability and text accessibility. If you need slide images for another workflow, a PPTX-to-JPG converter may be relevant, but check the resulting image quality before using it in a document.
Final PDF checklist
Before sending or printing the PDF, verify the following:
- Column boundaries line up from top to bottom.
- Row heights are consistent where intended.
- No text is clipped or unexpectedly wrapped.
- Headers remain aligned with their columns.
- Cell borders are visible and evenly weighted.
- The table remains inside the page margins.
- Fonts look consistent with the source presentation.
- Symbols, accented characters, and numbers display correctly.
- The table is readable at normal viewing size.
- A printed test page looks acceptable if the PDF will be printed.
Conclusion
PowerPoint tables shift in PDF when the conversion process has to reinterpret fonts, text fitting, measurements, or layered formatting. Start with the highest-impact fixes: use dependable fonts, remove automatic fitting, set explicit row and column dimensions, simplify borders, confirm slide size, and test a representative PDF before converting the entire deck.
For tables that remain unstable, rebuilding the affected table cleanly is often more reliable than repeatedly adjusting a damaged layout. A short visual check of the final PDF can catch misalignment before it reaches a client, classroom, printer, or archive.
Related: PowerPoint to PDF Conversion Methods Compared: Desktop, Browser, or Office Suite?
Related: How to Create a PDF Version of PowerPoint With a Separate Appendix